See Your Entire Network.
Monitoring, threat detection and incident response in one deployment. Every log stays on hardware you own.
Fully On-Premises
Air-gapped by design. No telemetry leaves your site, and no internet link is ever required.
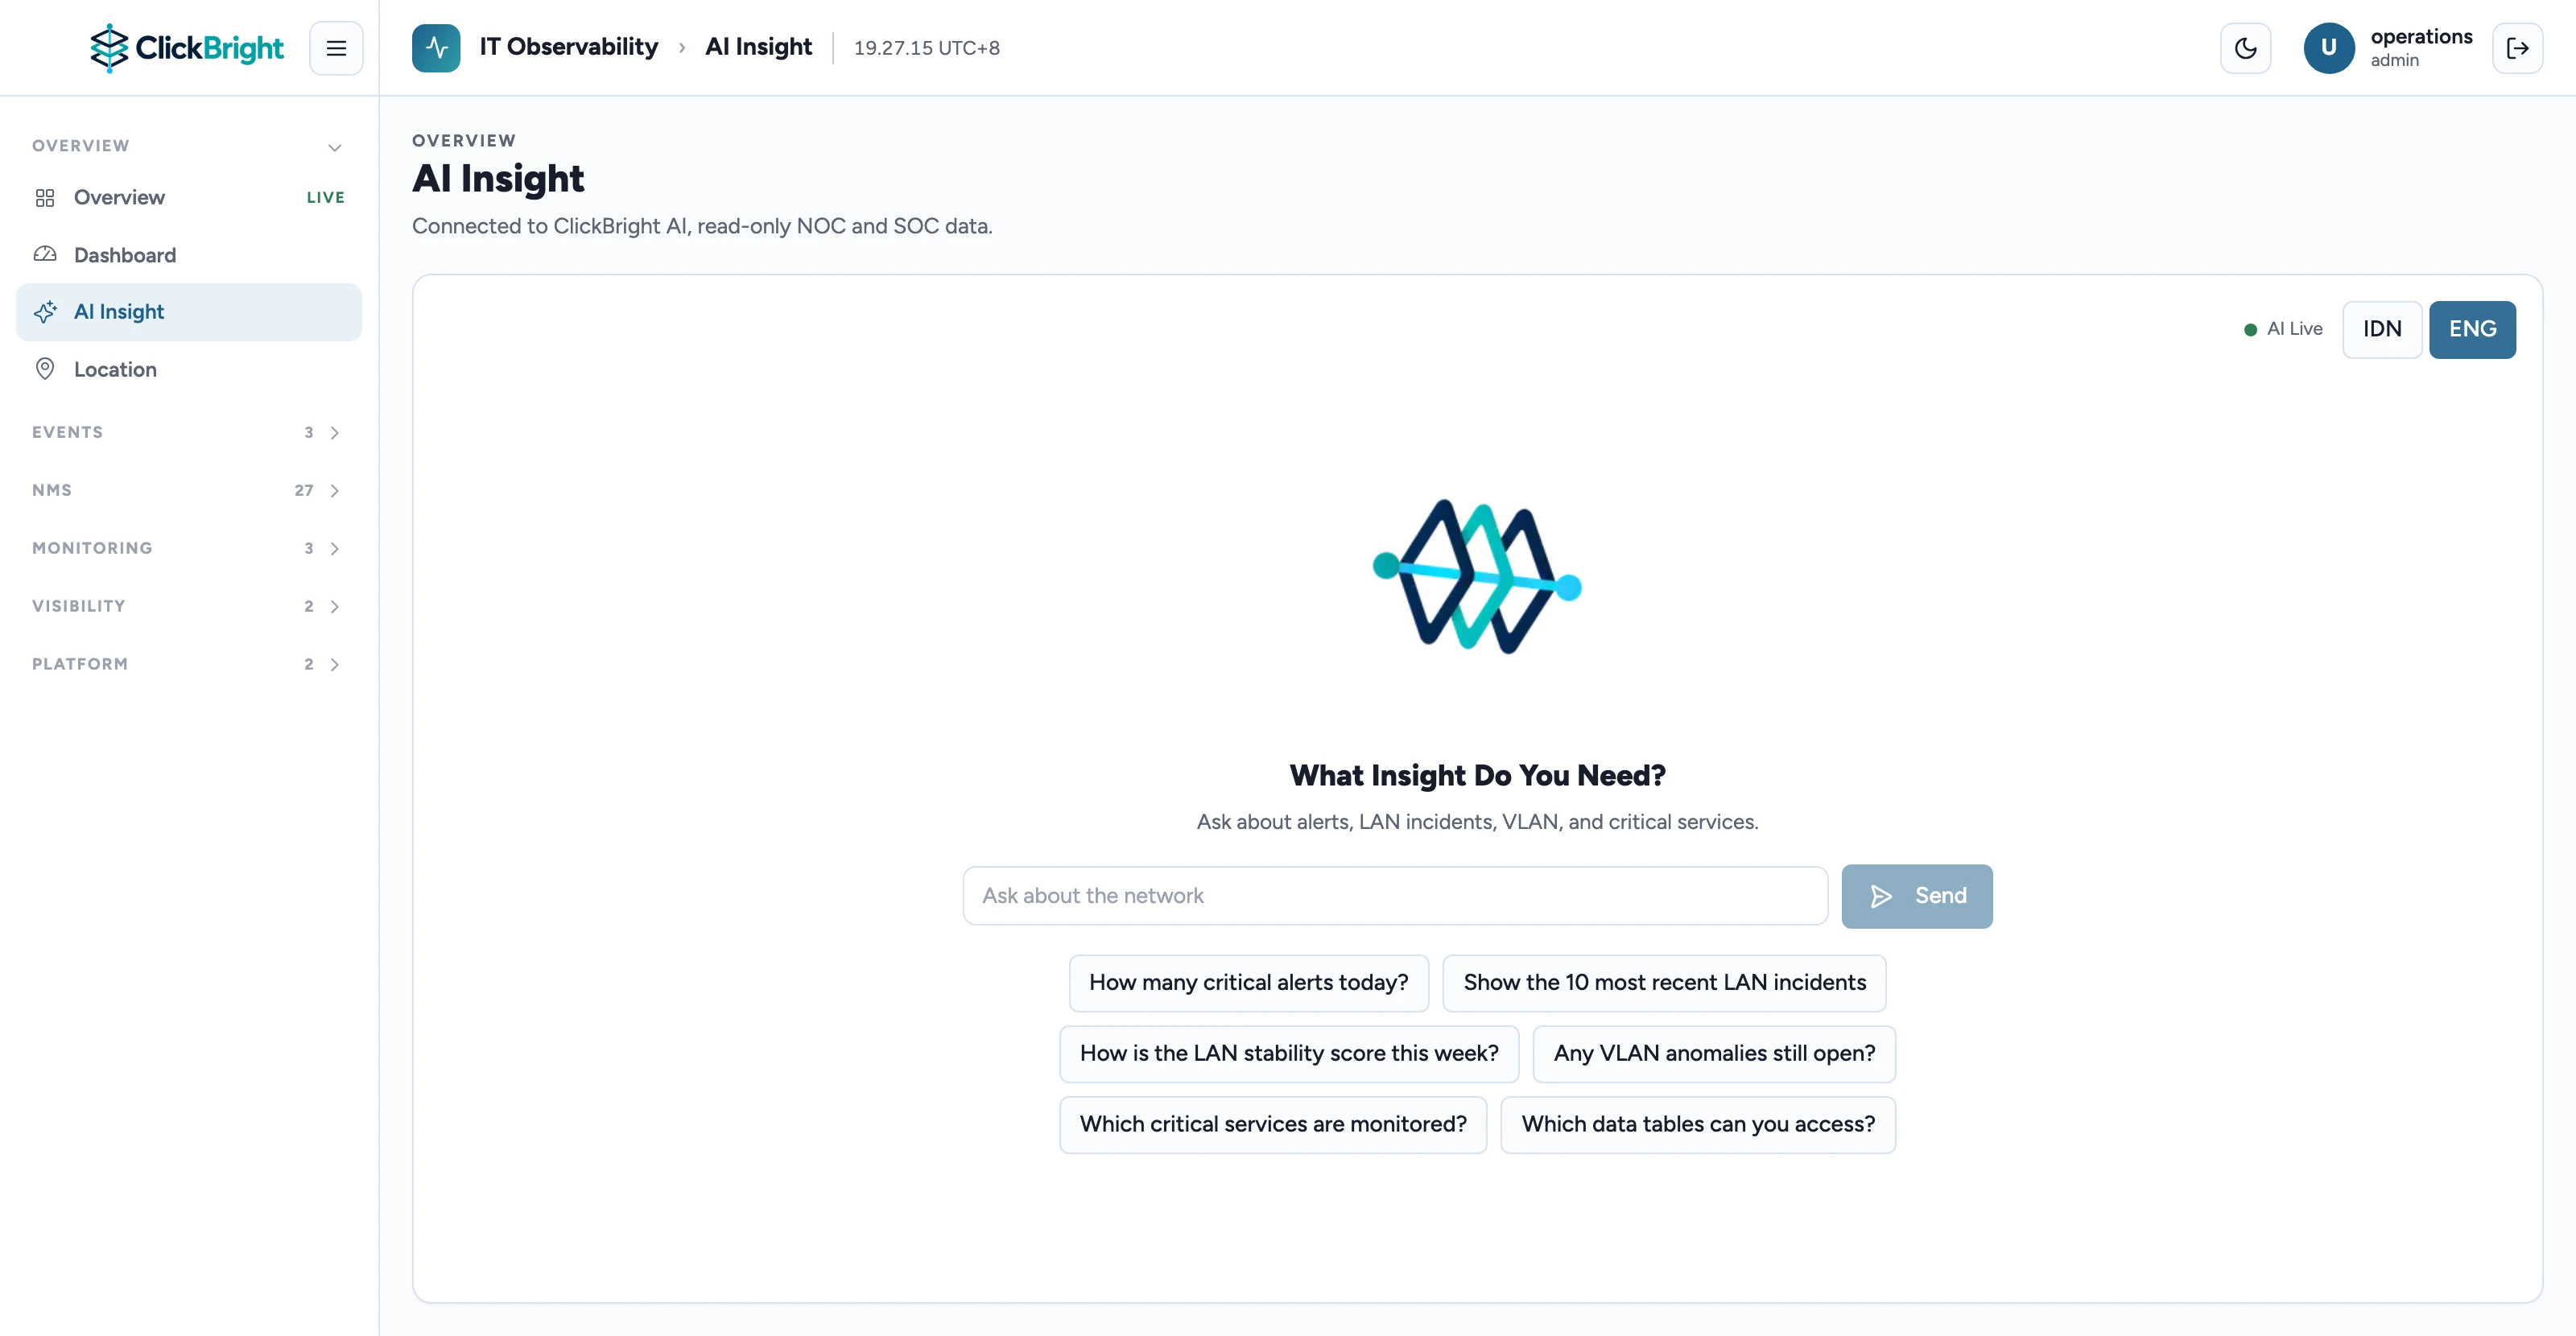
AI Insight
Ask in plain language. It analyses your operations and security data, and gives you the analysis.
Event Correlation
Alerts from every layer tied to the same asset and the same moment, so one incident reads as one story.
Automatic RCA
A live dependency graph walks from the failing component out to everything it touches.
Three Products Most Teams Buy Separately
Infrastructure monitoring, SIEM for security, SOAR for response. That is usually three procurements, three vendors, and three teams whose data never meets.
Observability
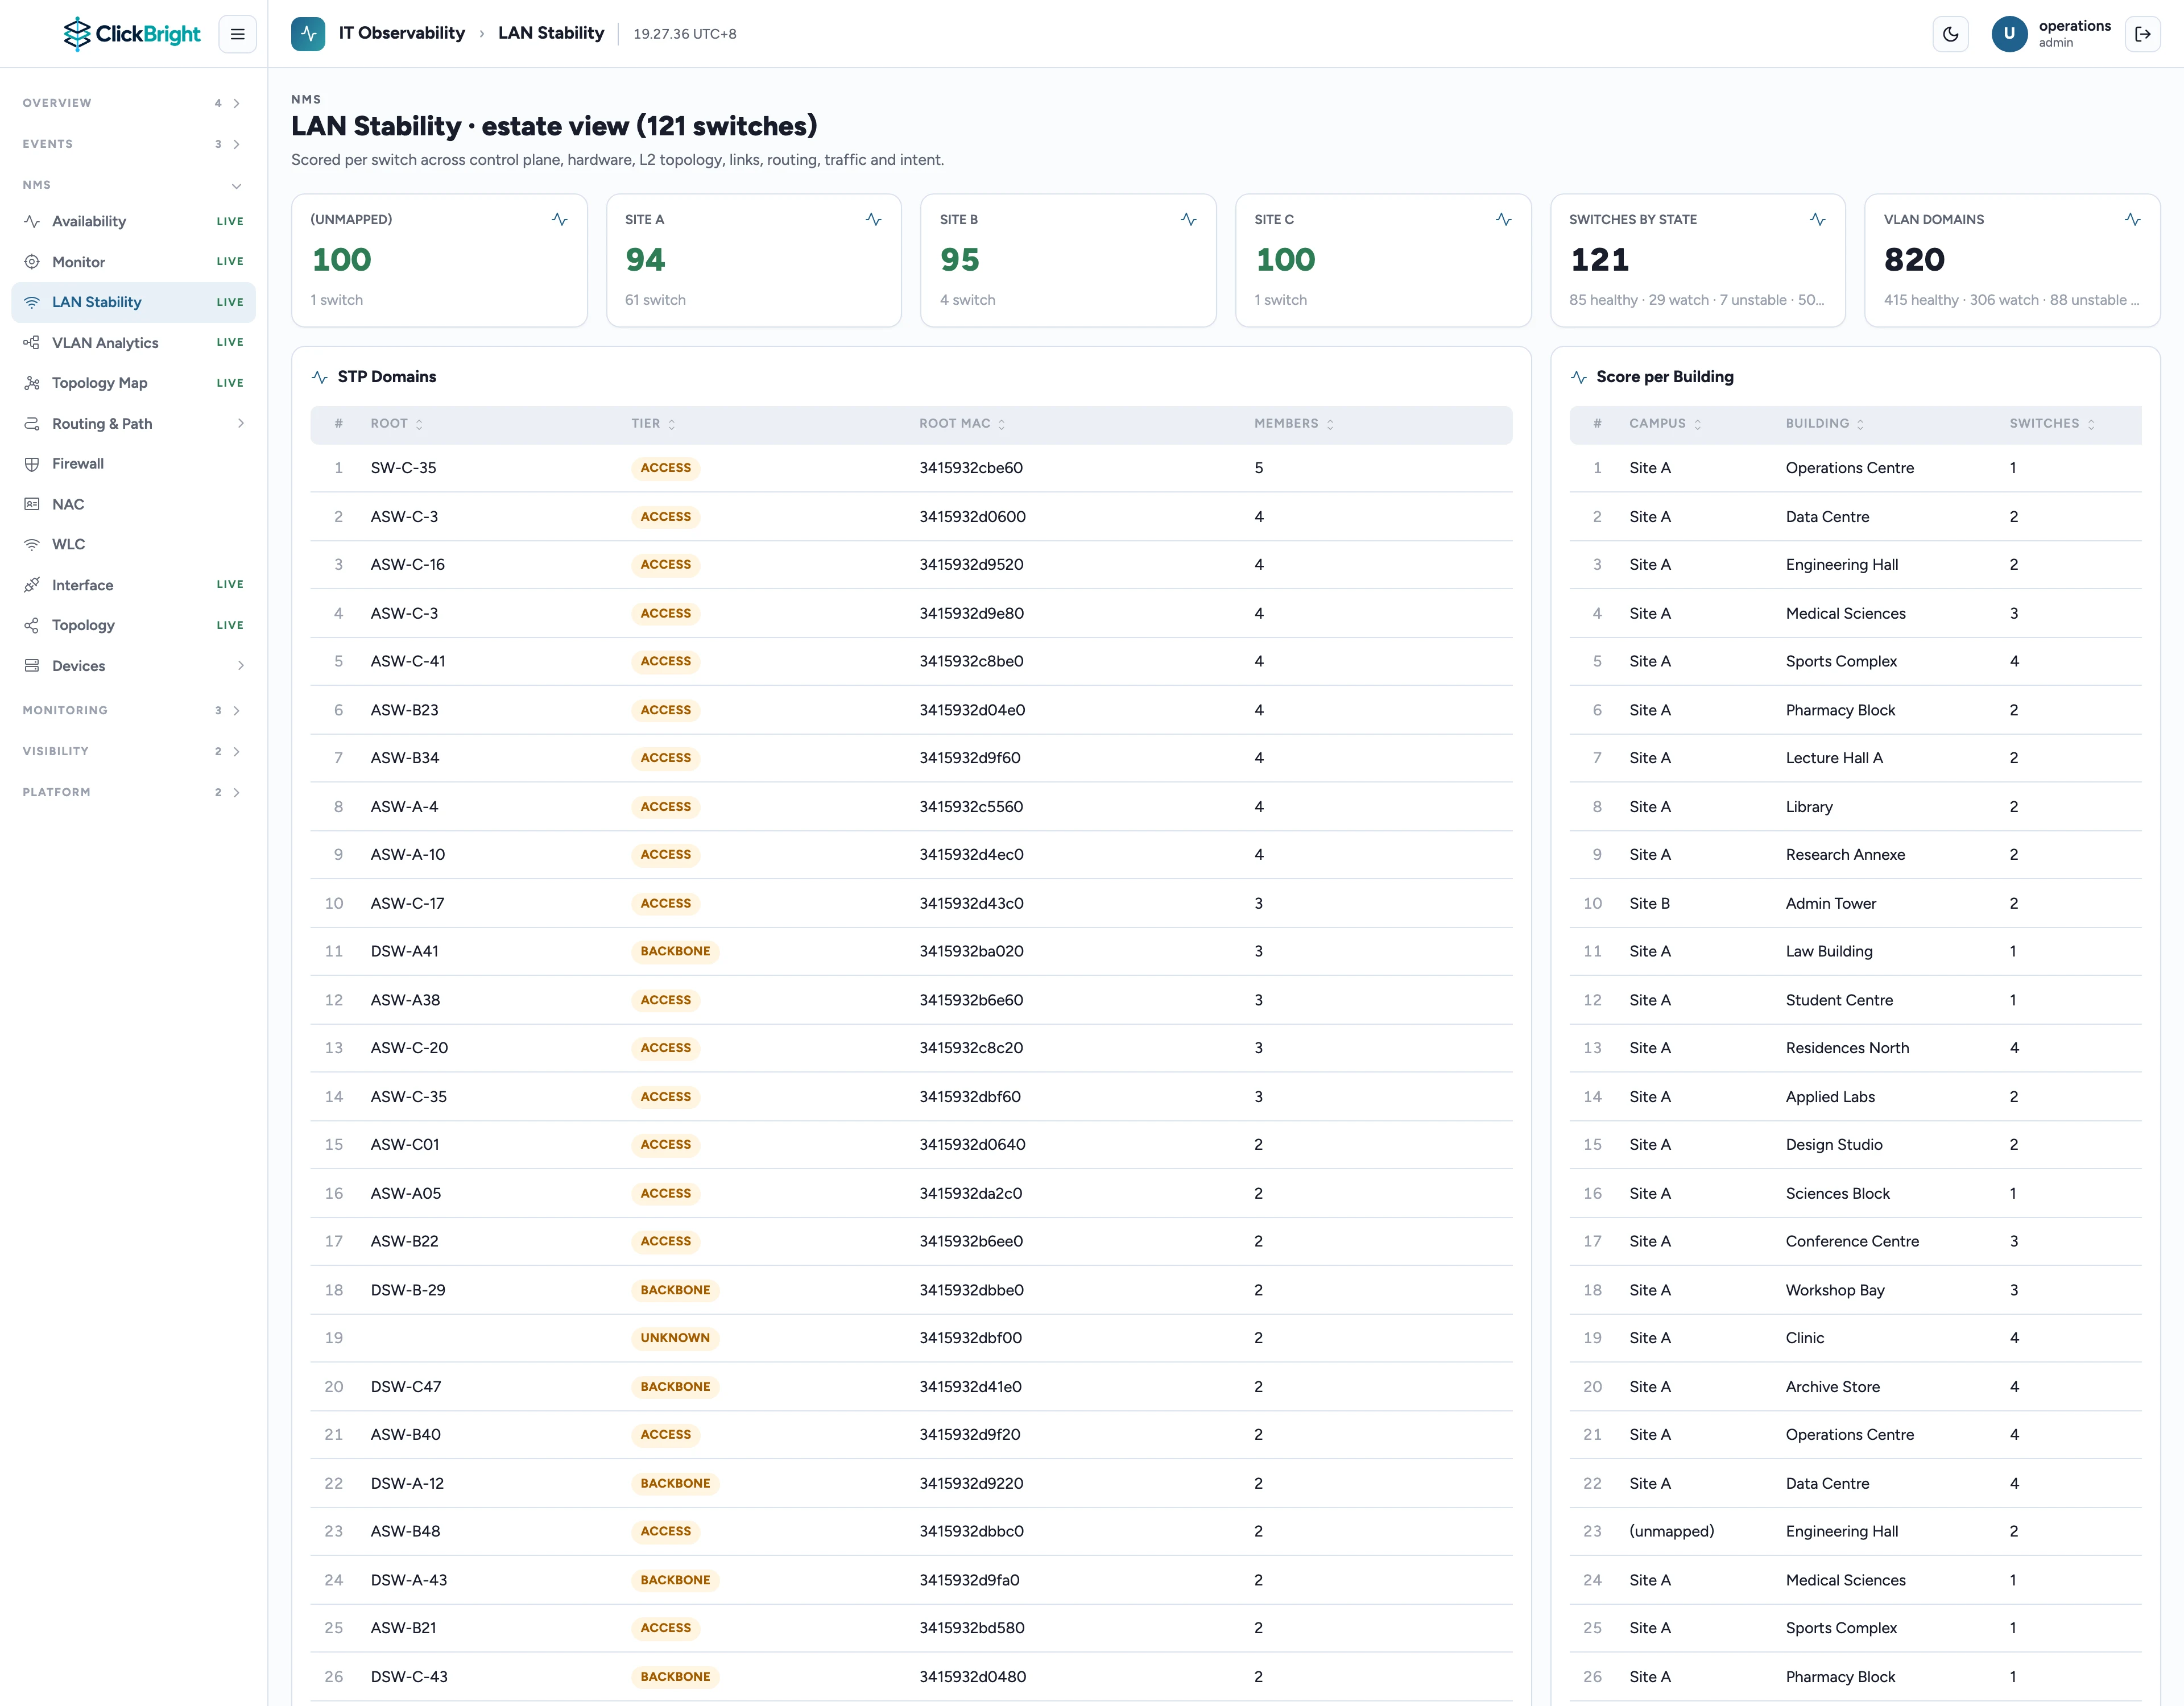
Devices, users, sessions and traffic across 28 linked views. Metrics and logs each sit in the store built for them.

SIEM
Detection rules run continuously against your logs, then match indicators of compromise from a threat intelligence database.
SOAR
Alert triage that cuts the noise, digital forensics case management, and automated ticketing and escalation.
On-Premises
Air-gapped. No outbound telemetry, no cloud subscription, and no dependency on an internet link staying up.
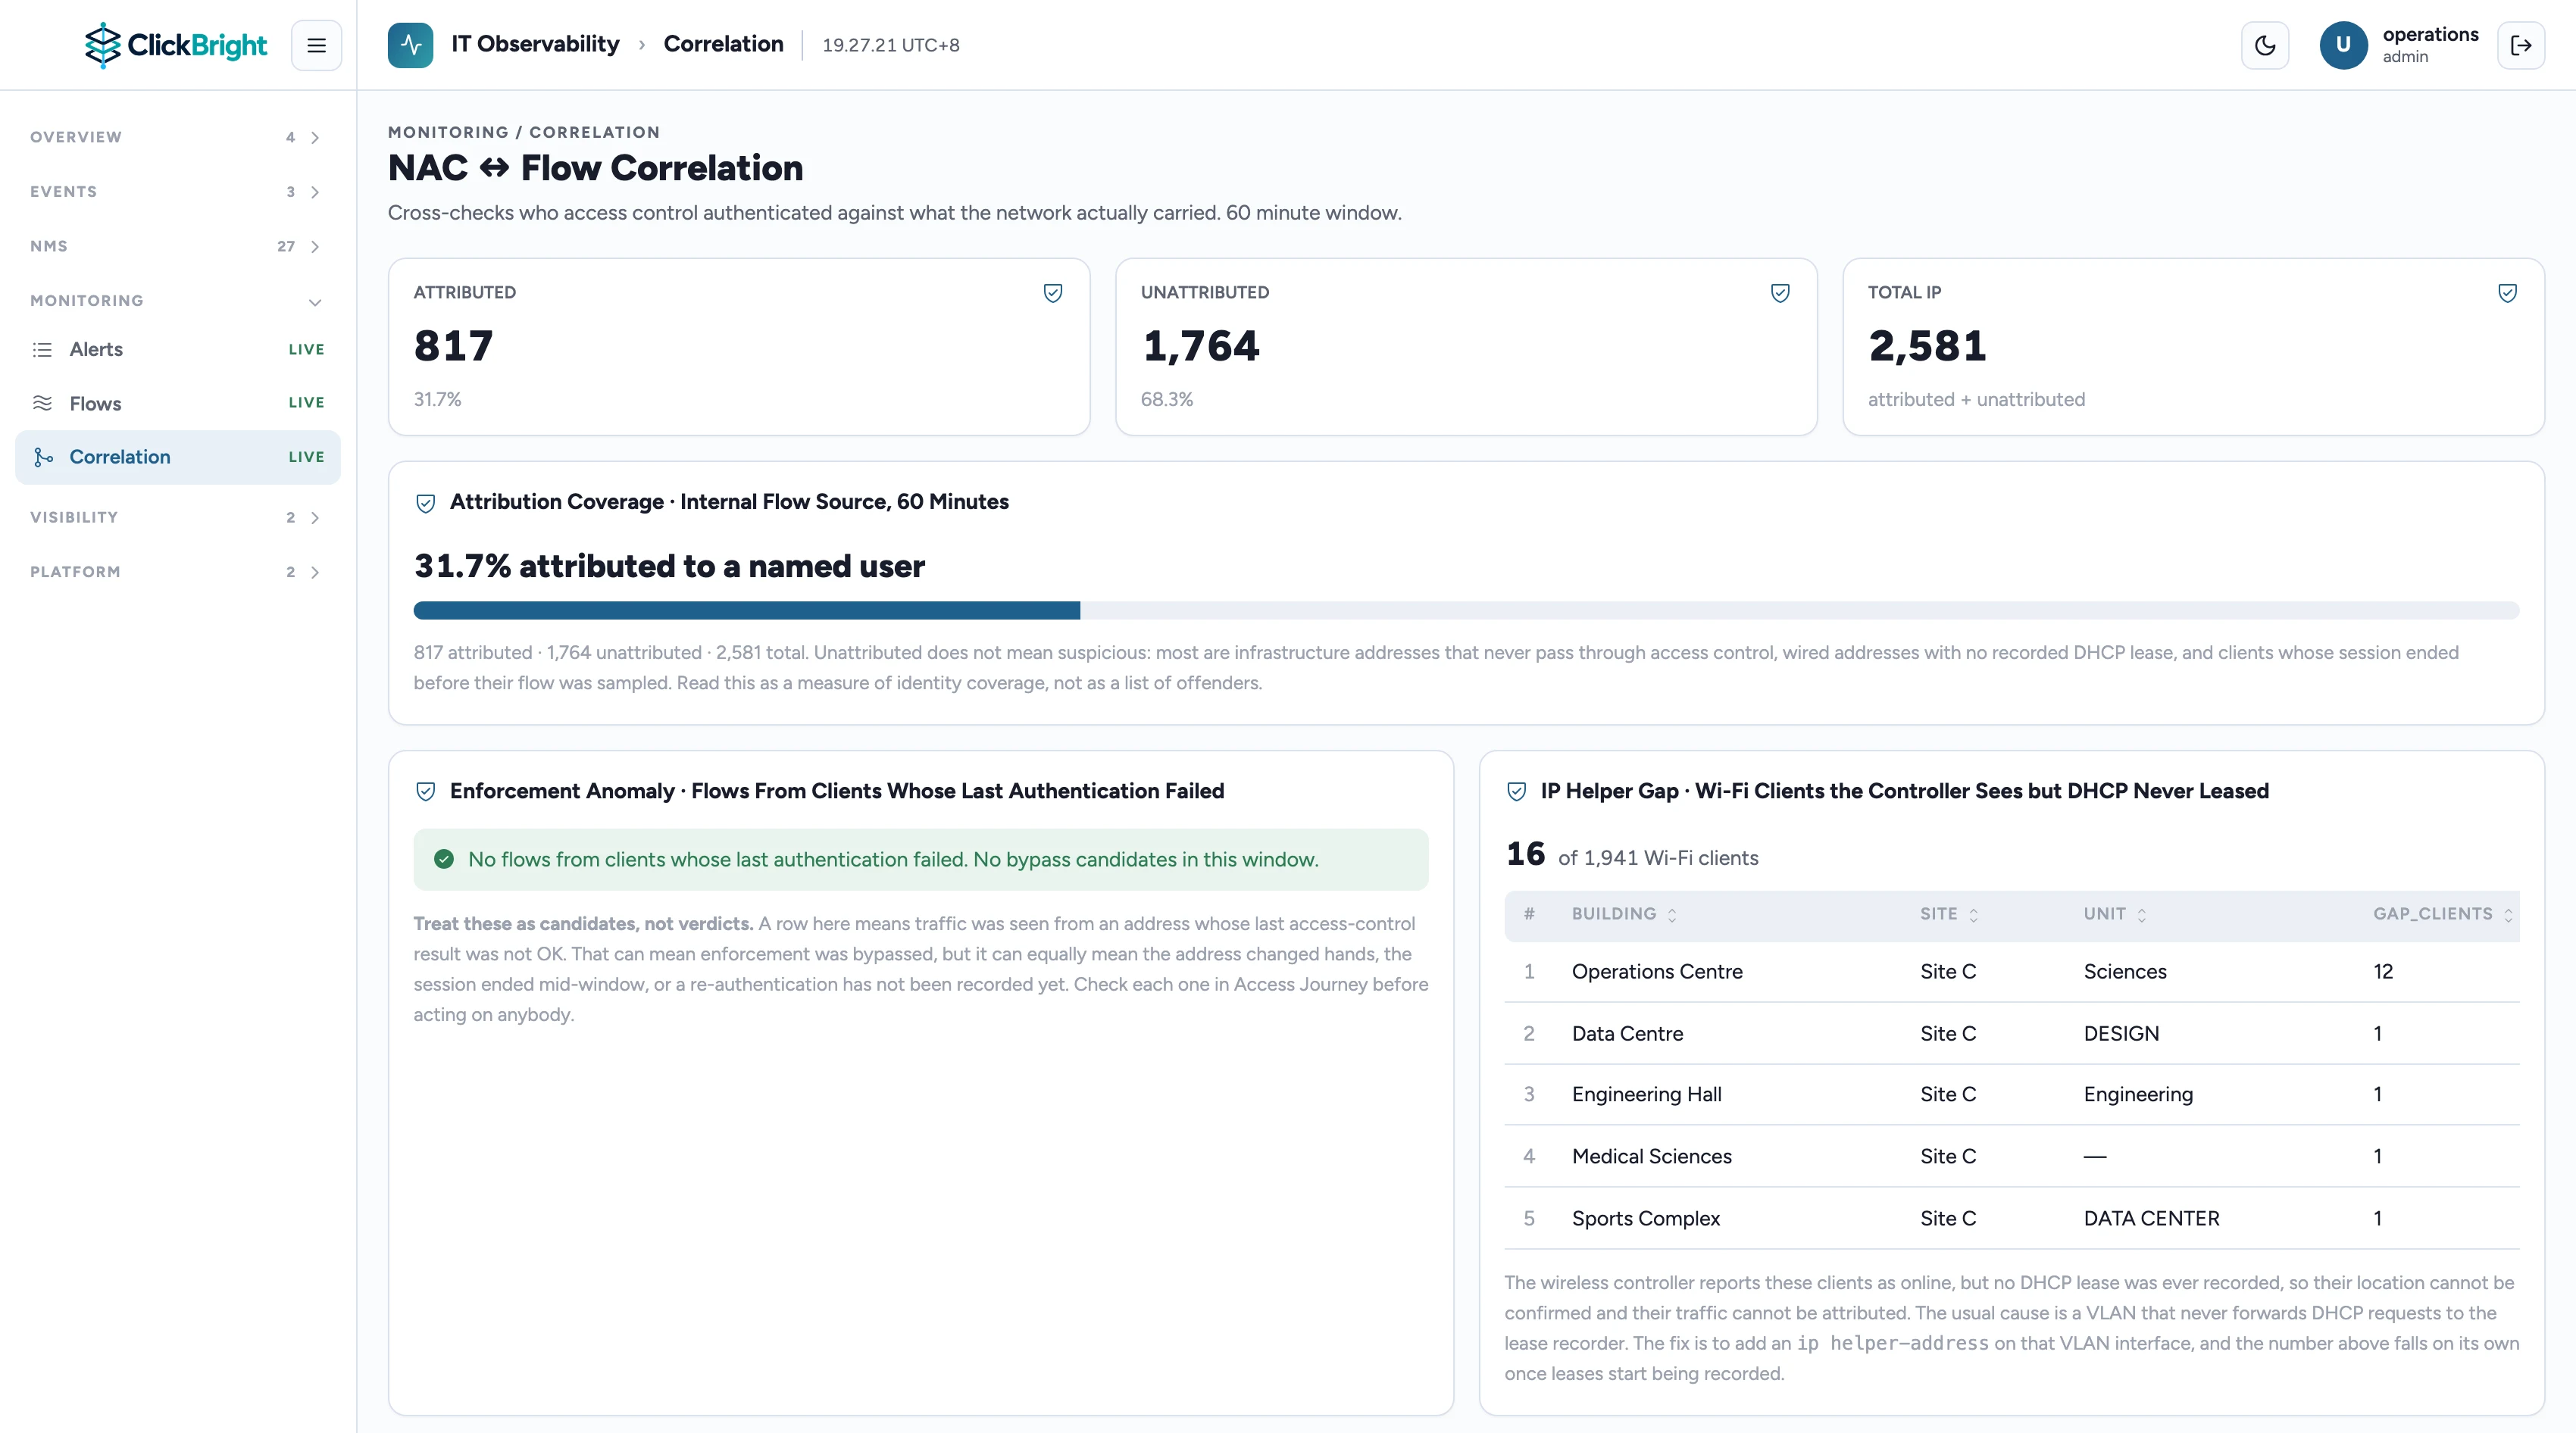
Correlation across layers. Identity from access control, traffic from the network, and security alerts from your logs, lined up against each other. The gap between them is exactly what gets missed when three tools each own one piece.
From Network Data to Clear Decisions
Every stage runs inside your own facility. Nothing leaves the building, and the console that operators work in has no write path back to the network.

Every Component ClickBright Runs On
ClickBright is assembled from six working layers, each one doing a defined job on the way from raw telemetry to the decision on screen.
Telemetry Collection
Firewalls, secure web gateways, routers, switches, Linux and Windows hosts, plus database and storage subsystems.
Event Streaming
A high-throughput backbone that keeps delivery guaranteed when every source reports at once.
Storage and Correlation
Metrics and logs land in the store each one belongs in, while a live dependency graph supports impact analysis and root cause.
Threat Intelligence
Indicators of compromise matched automatically, with raw alerts triaged before they ever reach an analyst.
Case Management and Automation
Forensic case handling for real escalations, plus workflow automation for tickets, notifications and webhooks.
ClickBright User Interface
Twenty-eight views that turn every layer below into something a director can read without an engineer sitting beside them, plus an assistant you can question in plain language.
One Console for Everything You Monitor
From user authentication to adjacency between core switches. Every view behaves the same way, so your team learns the tool once and keeps that knowledge everywhere.
Overview
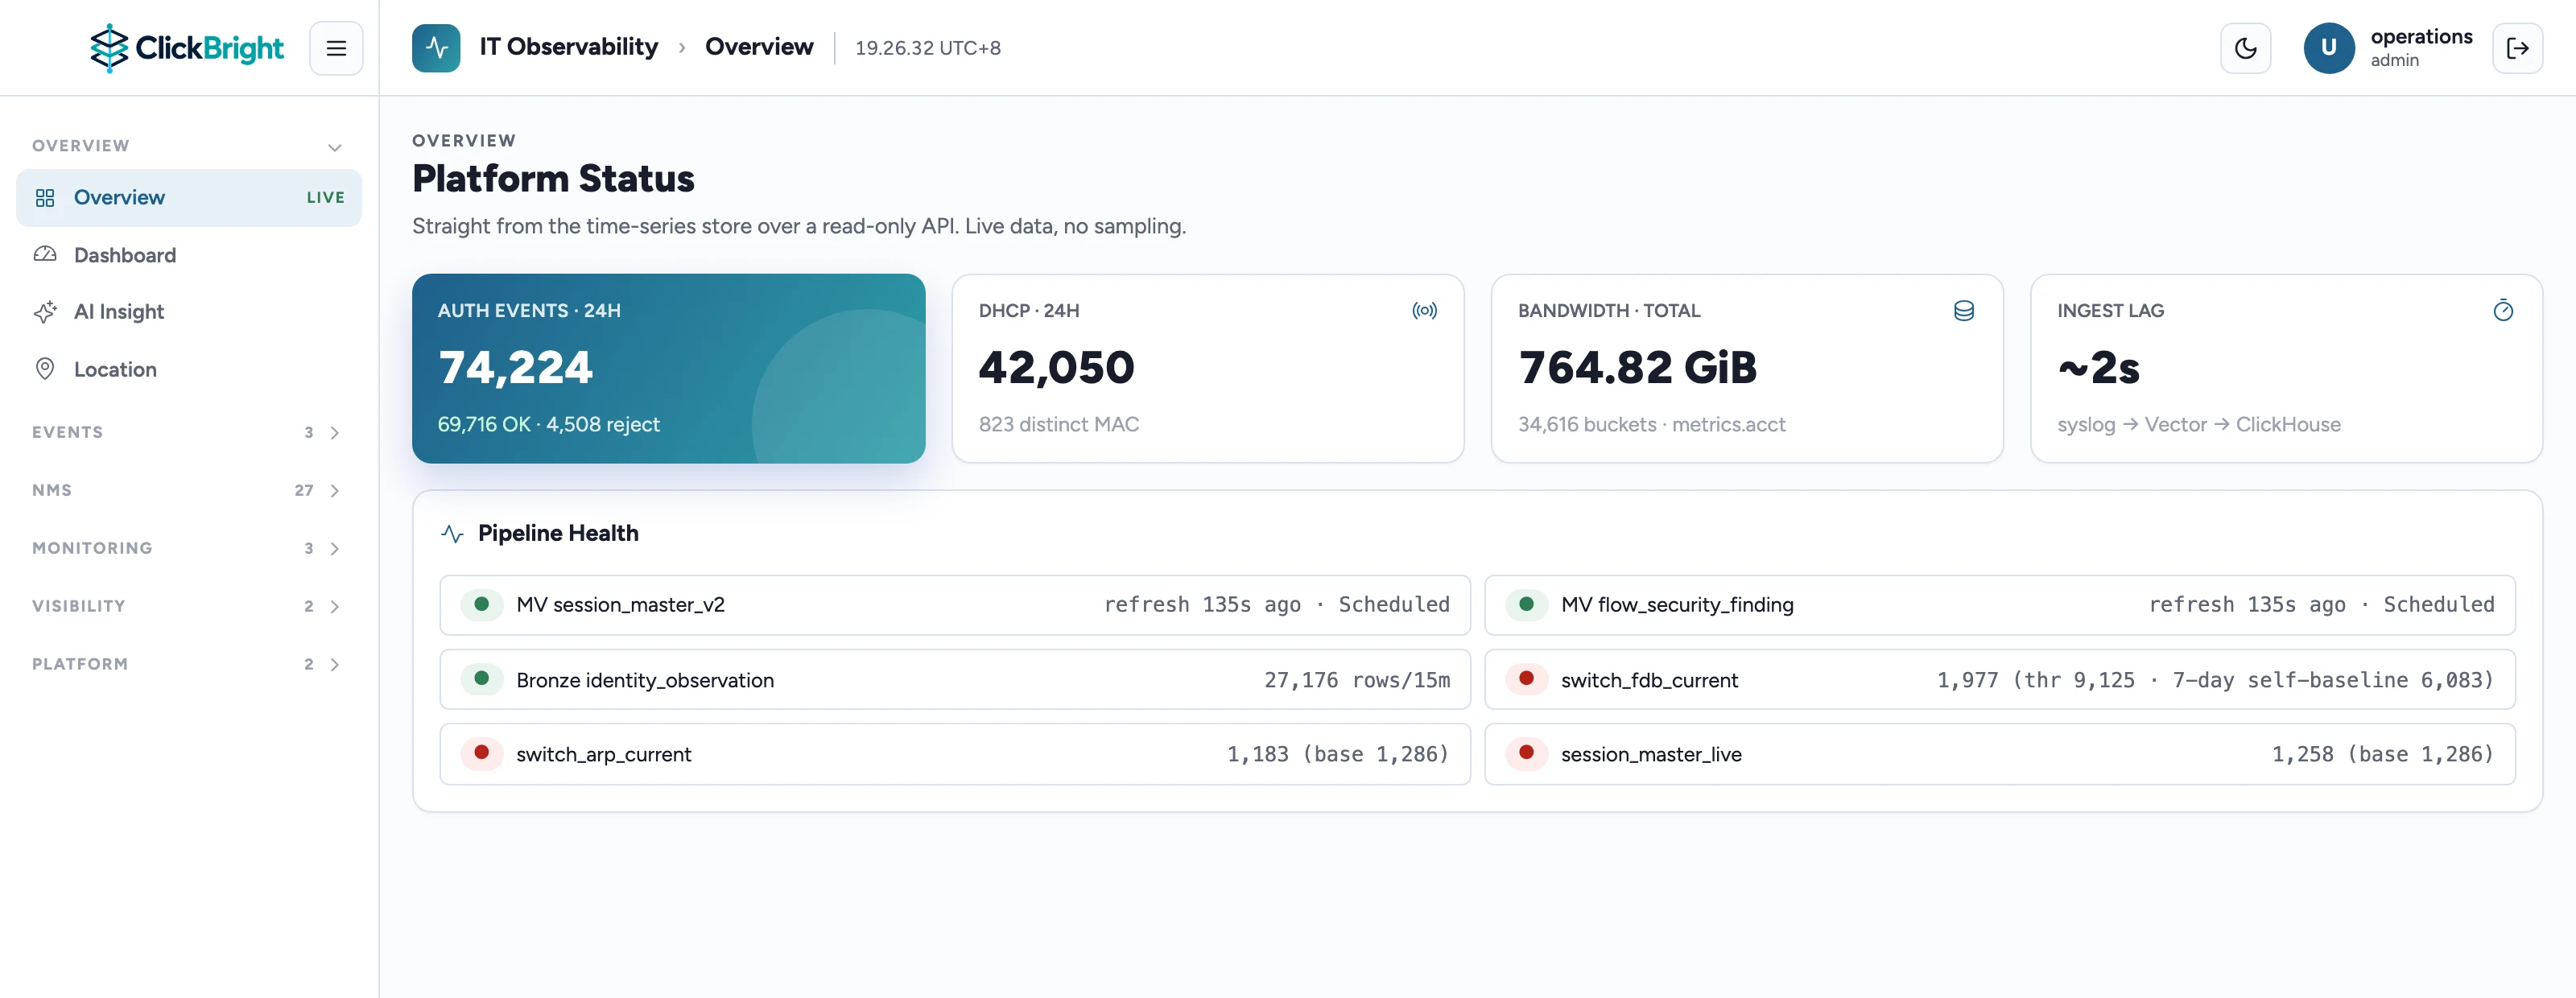
4 viewsEstate health on one screen, per-building coverage, and AI Insight
Events
3 viewsWho authenticated, from where, and how much they pulled
Infrastructure
11 viewsFirewall, access control, routing, VLAN and layered topology
Monitoring
3 viewsAlerts, traffic flows, and correlation between events
Visibility
3 viewsTrace one user or one endpoint down to the switch port
Per Device
4 viewsFull dossier per device, from running config to interface metrics
What You Actually Look At
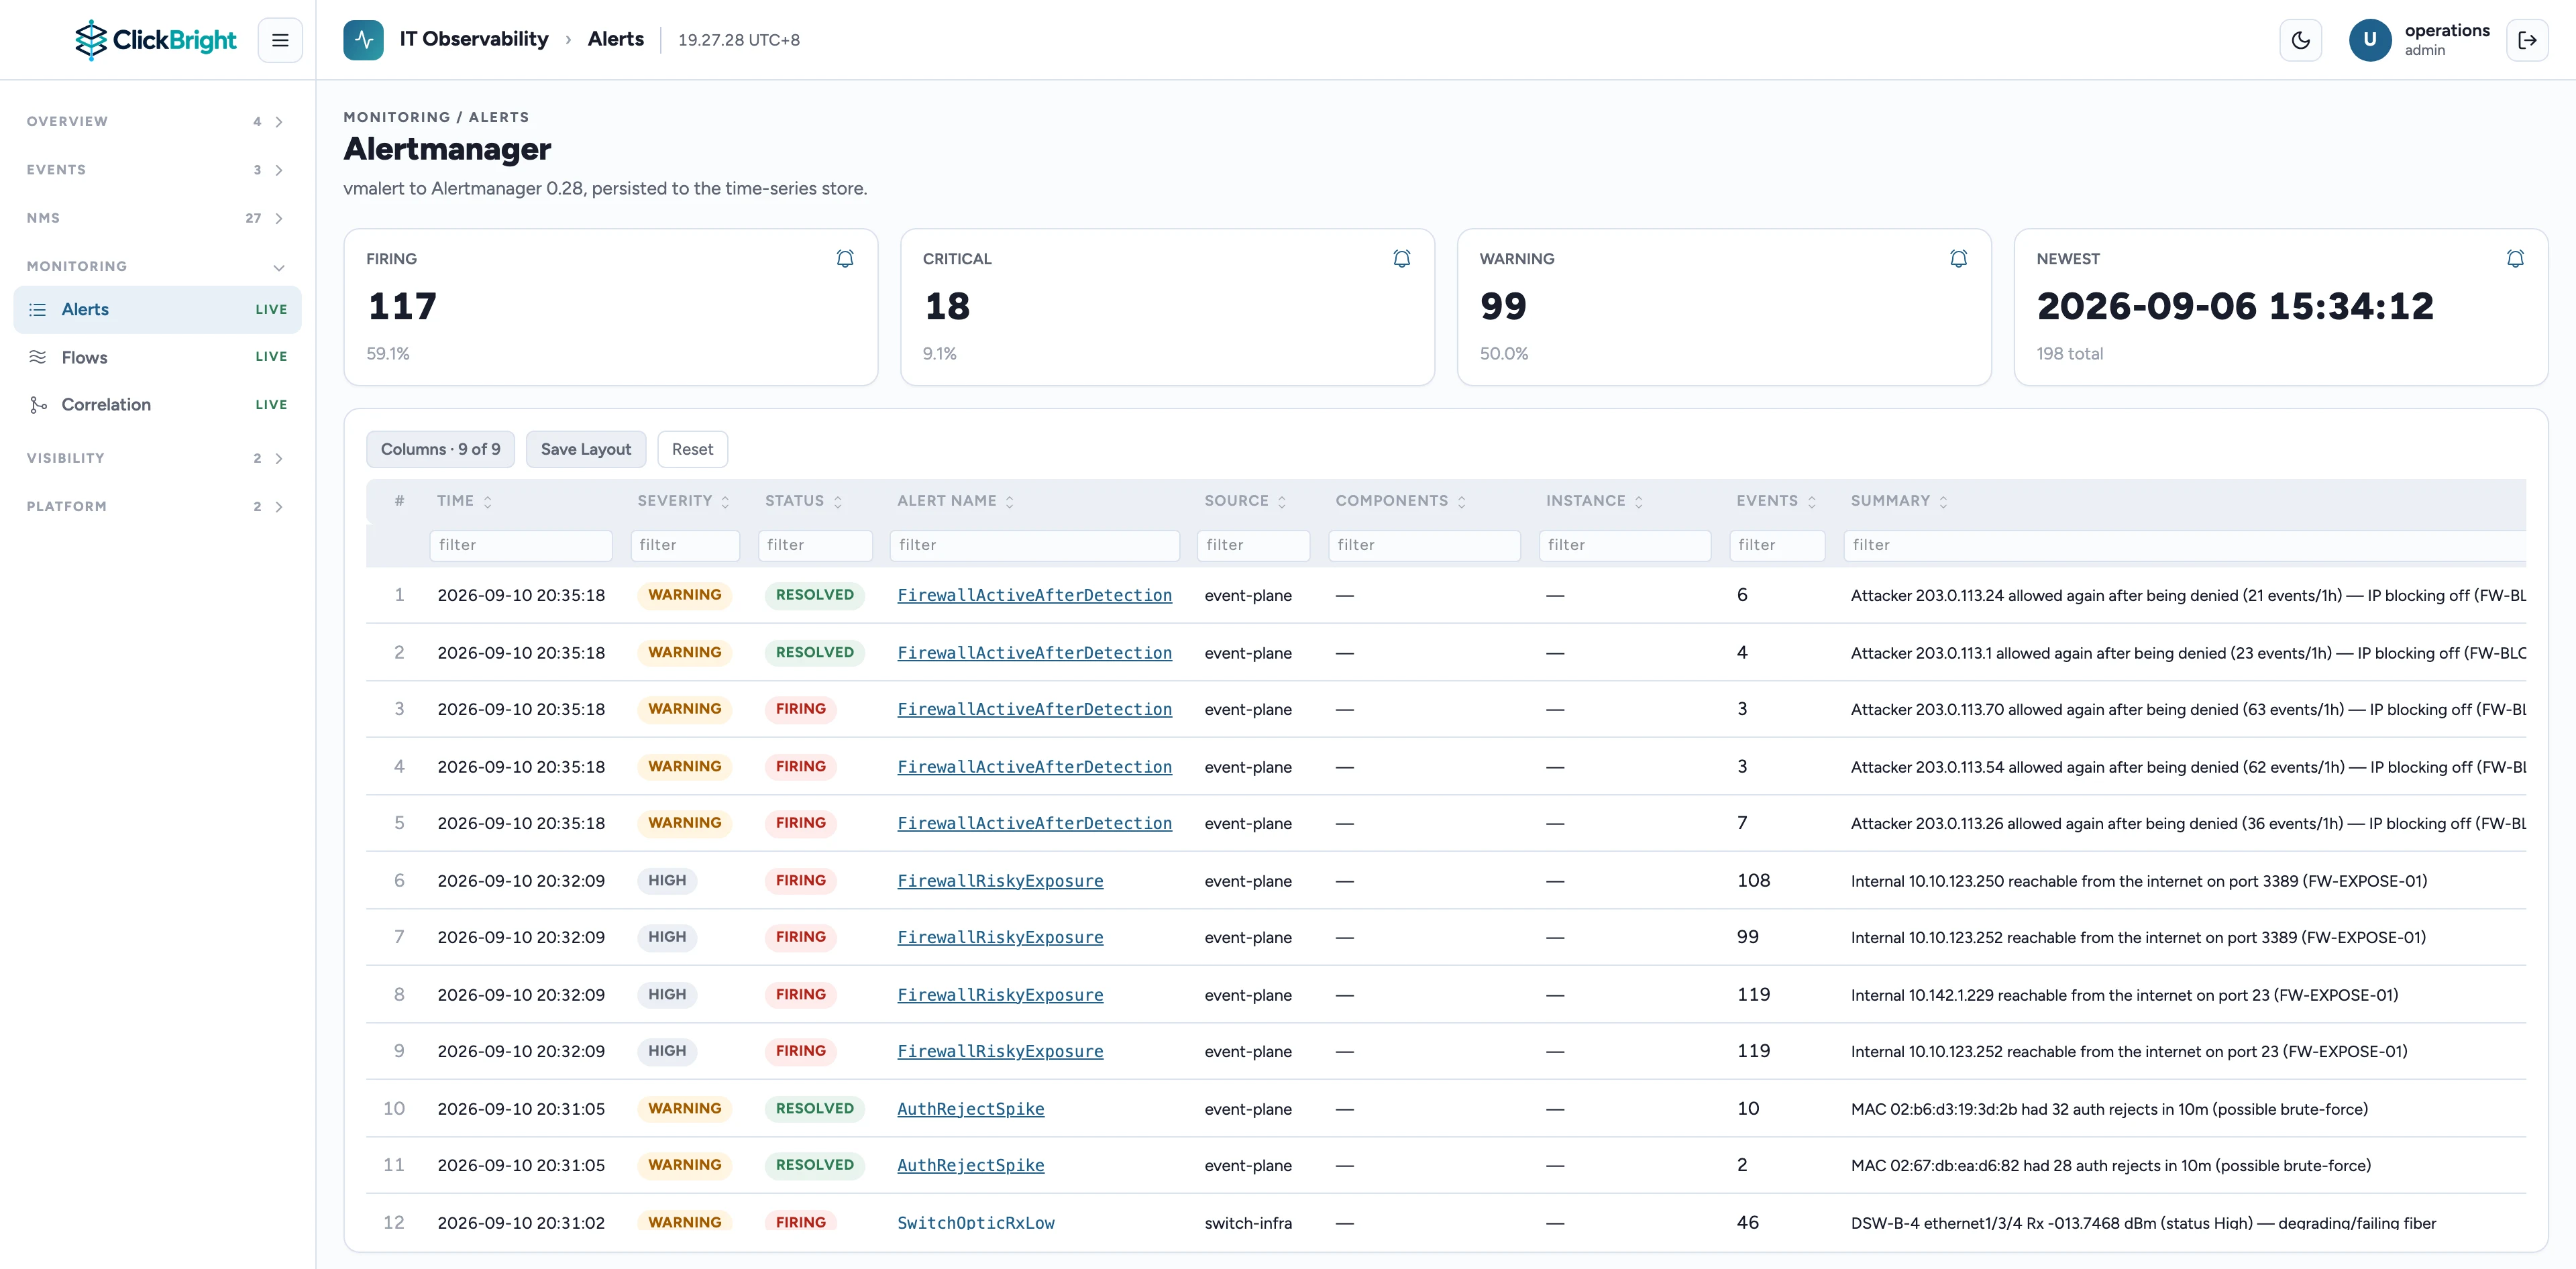
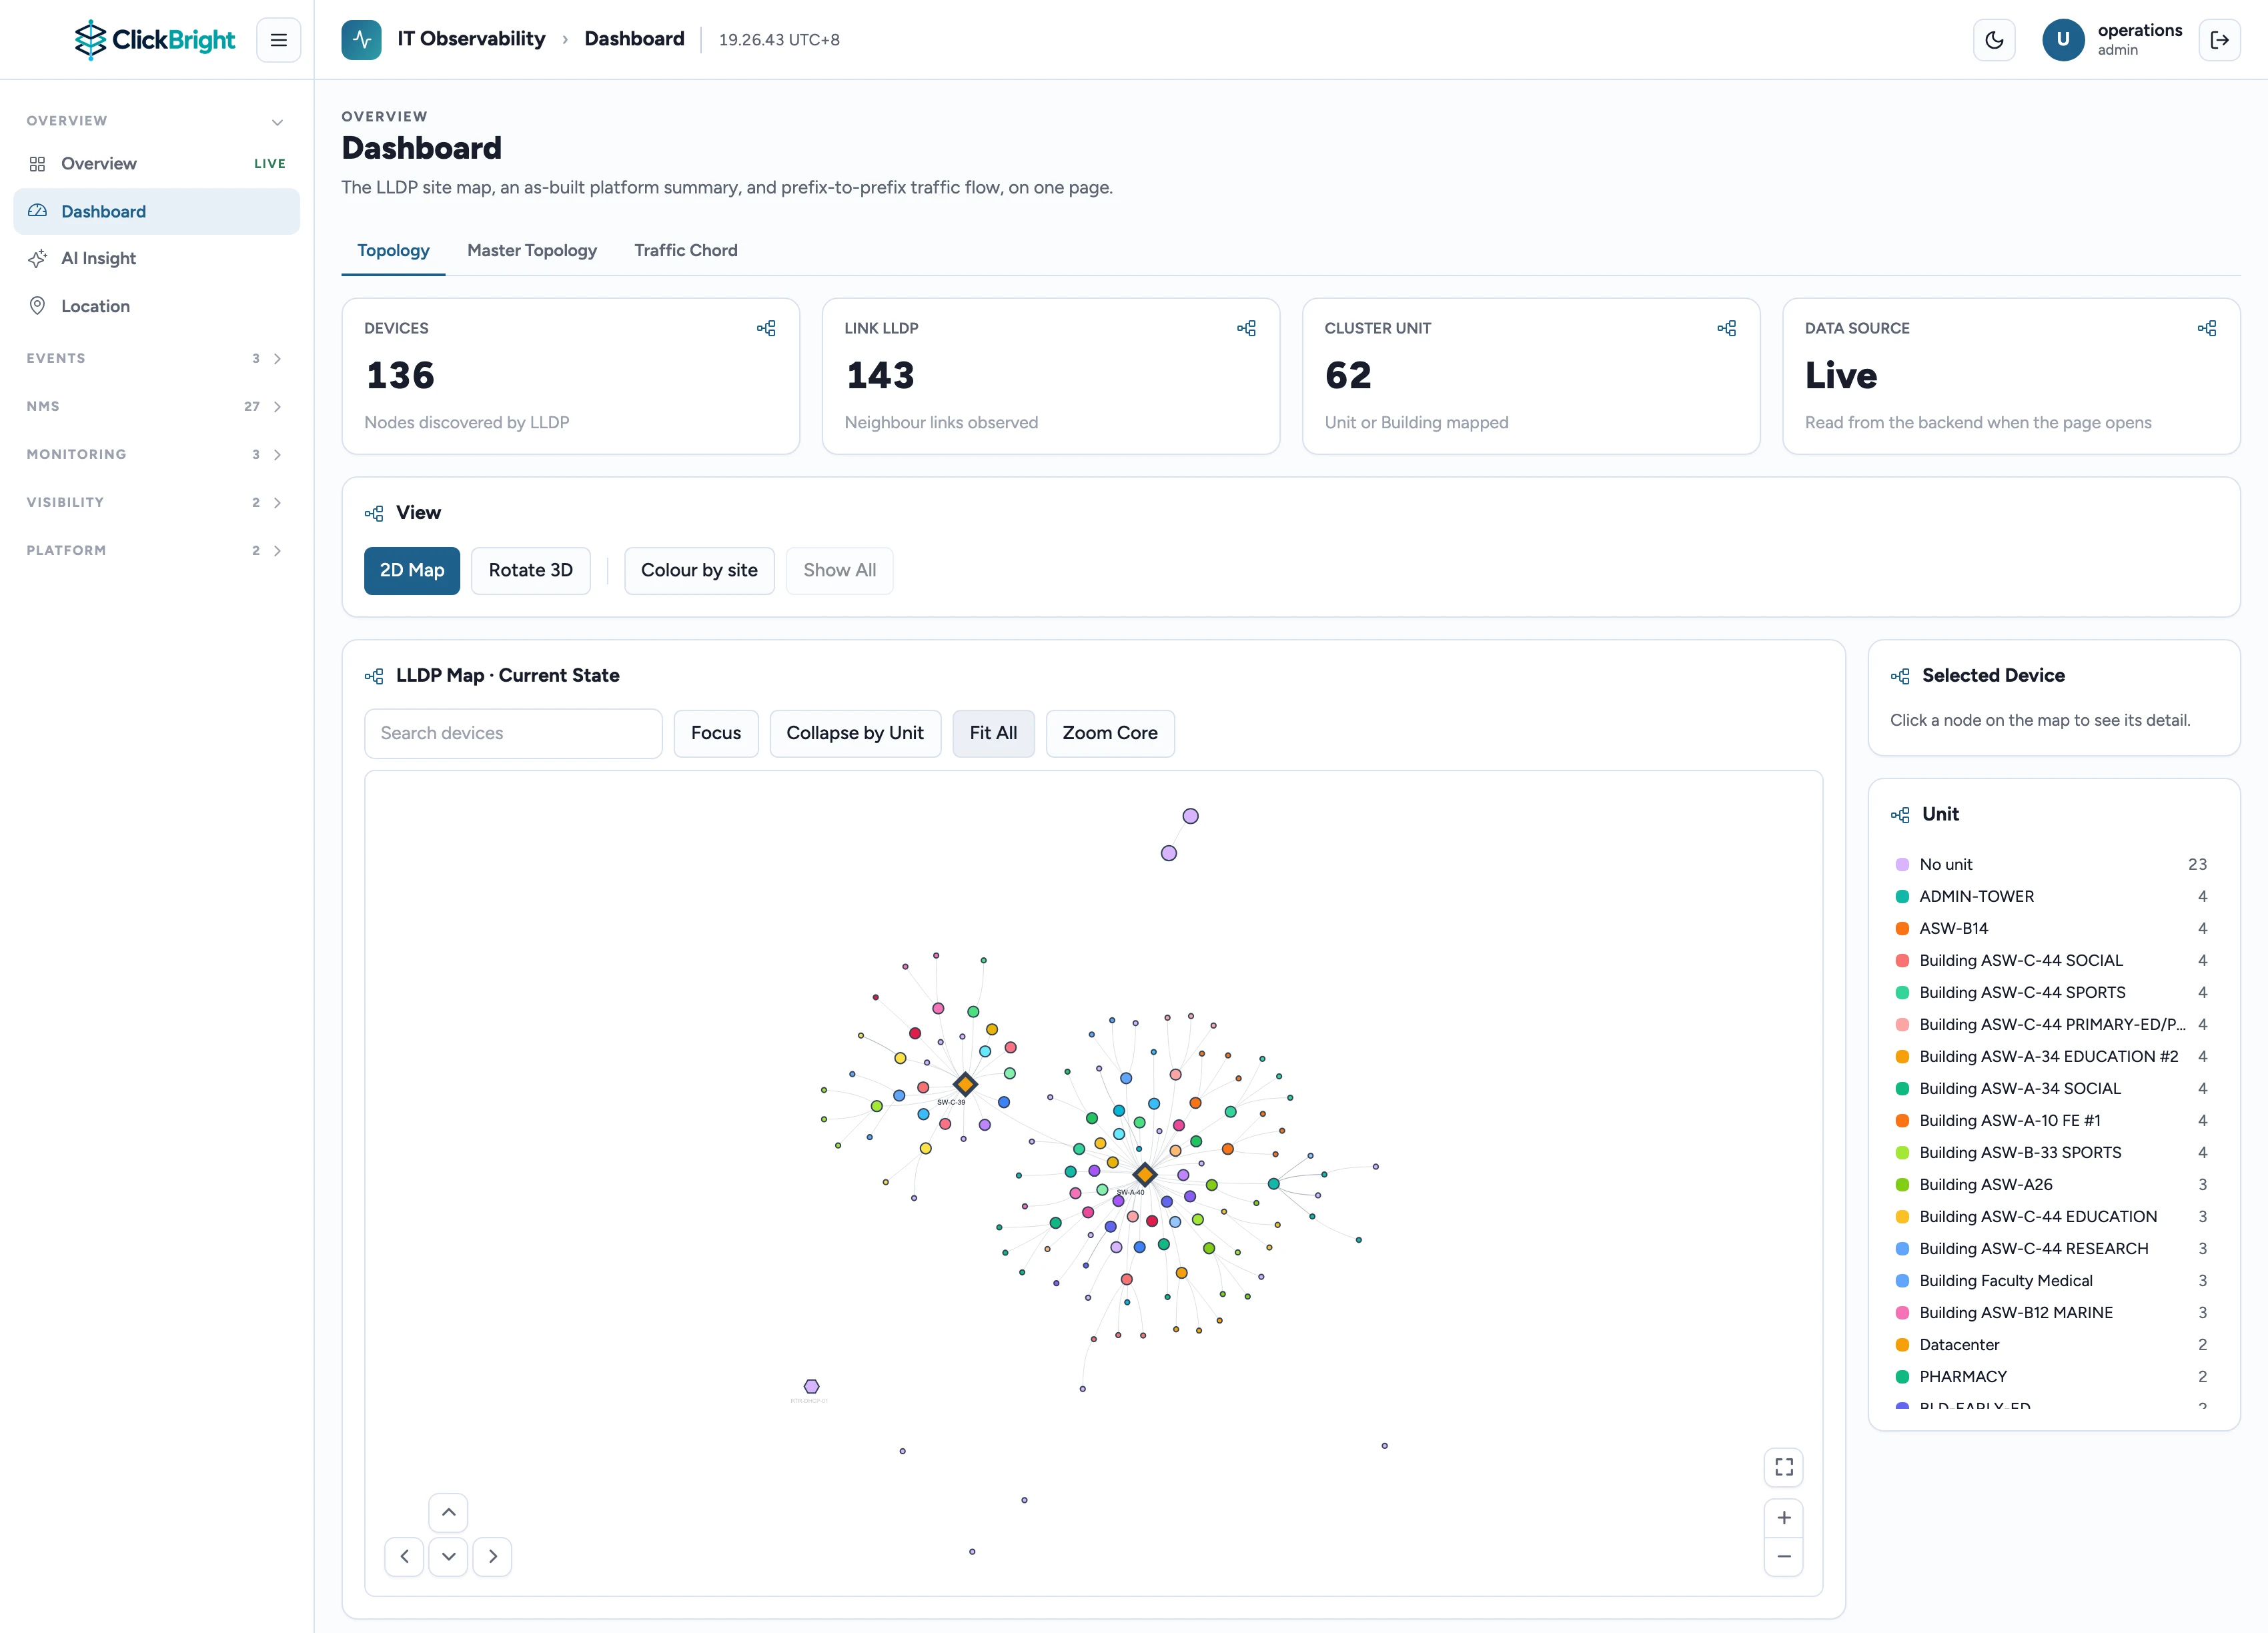
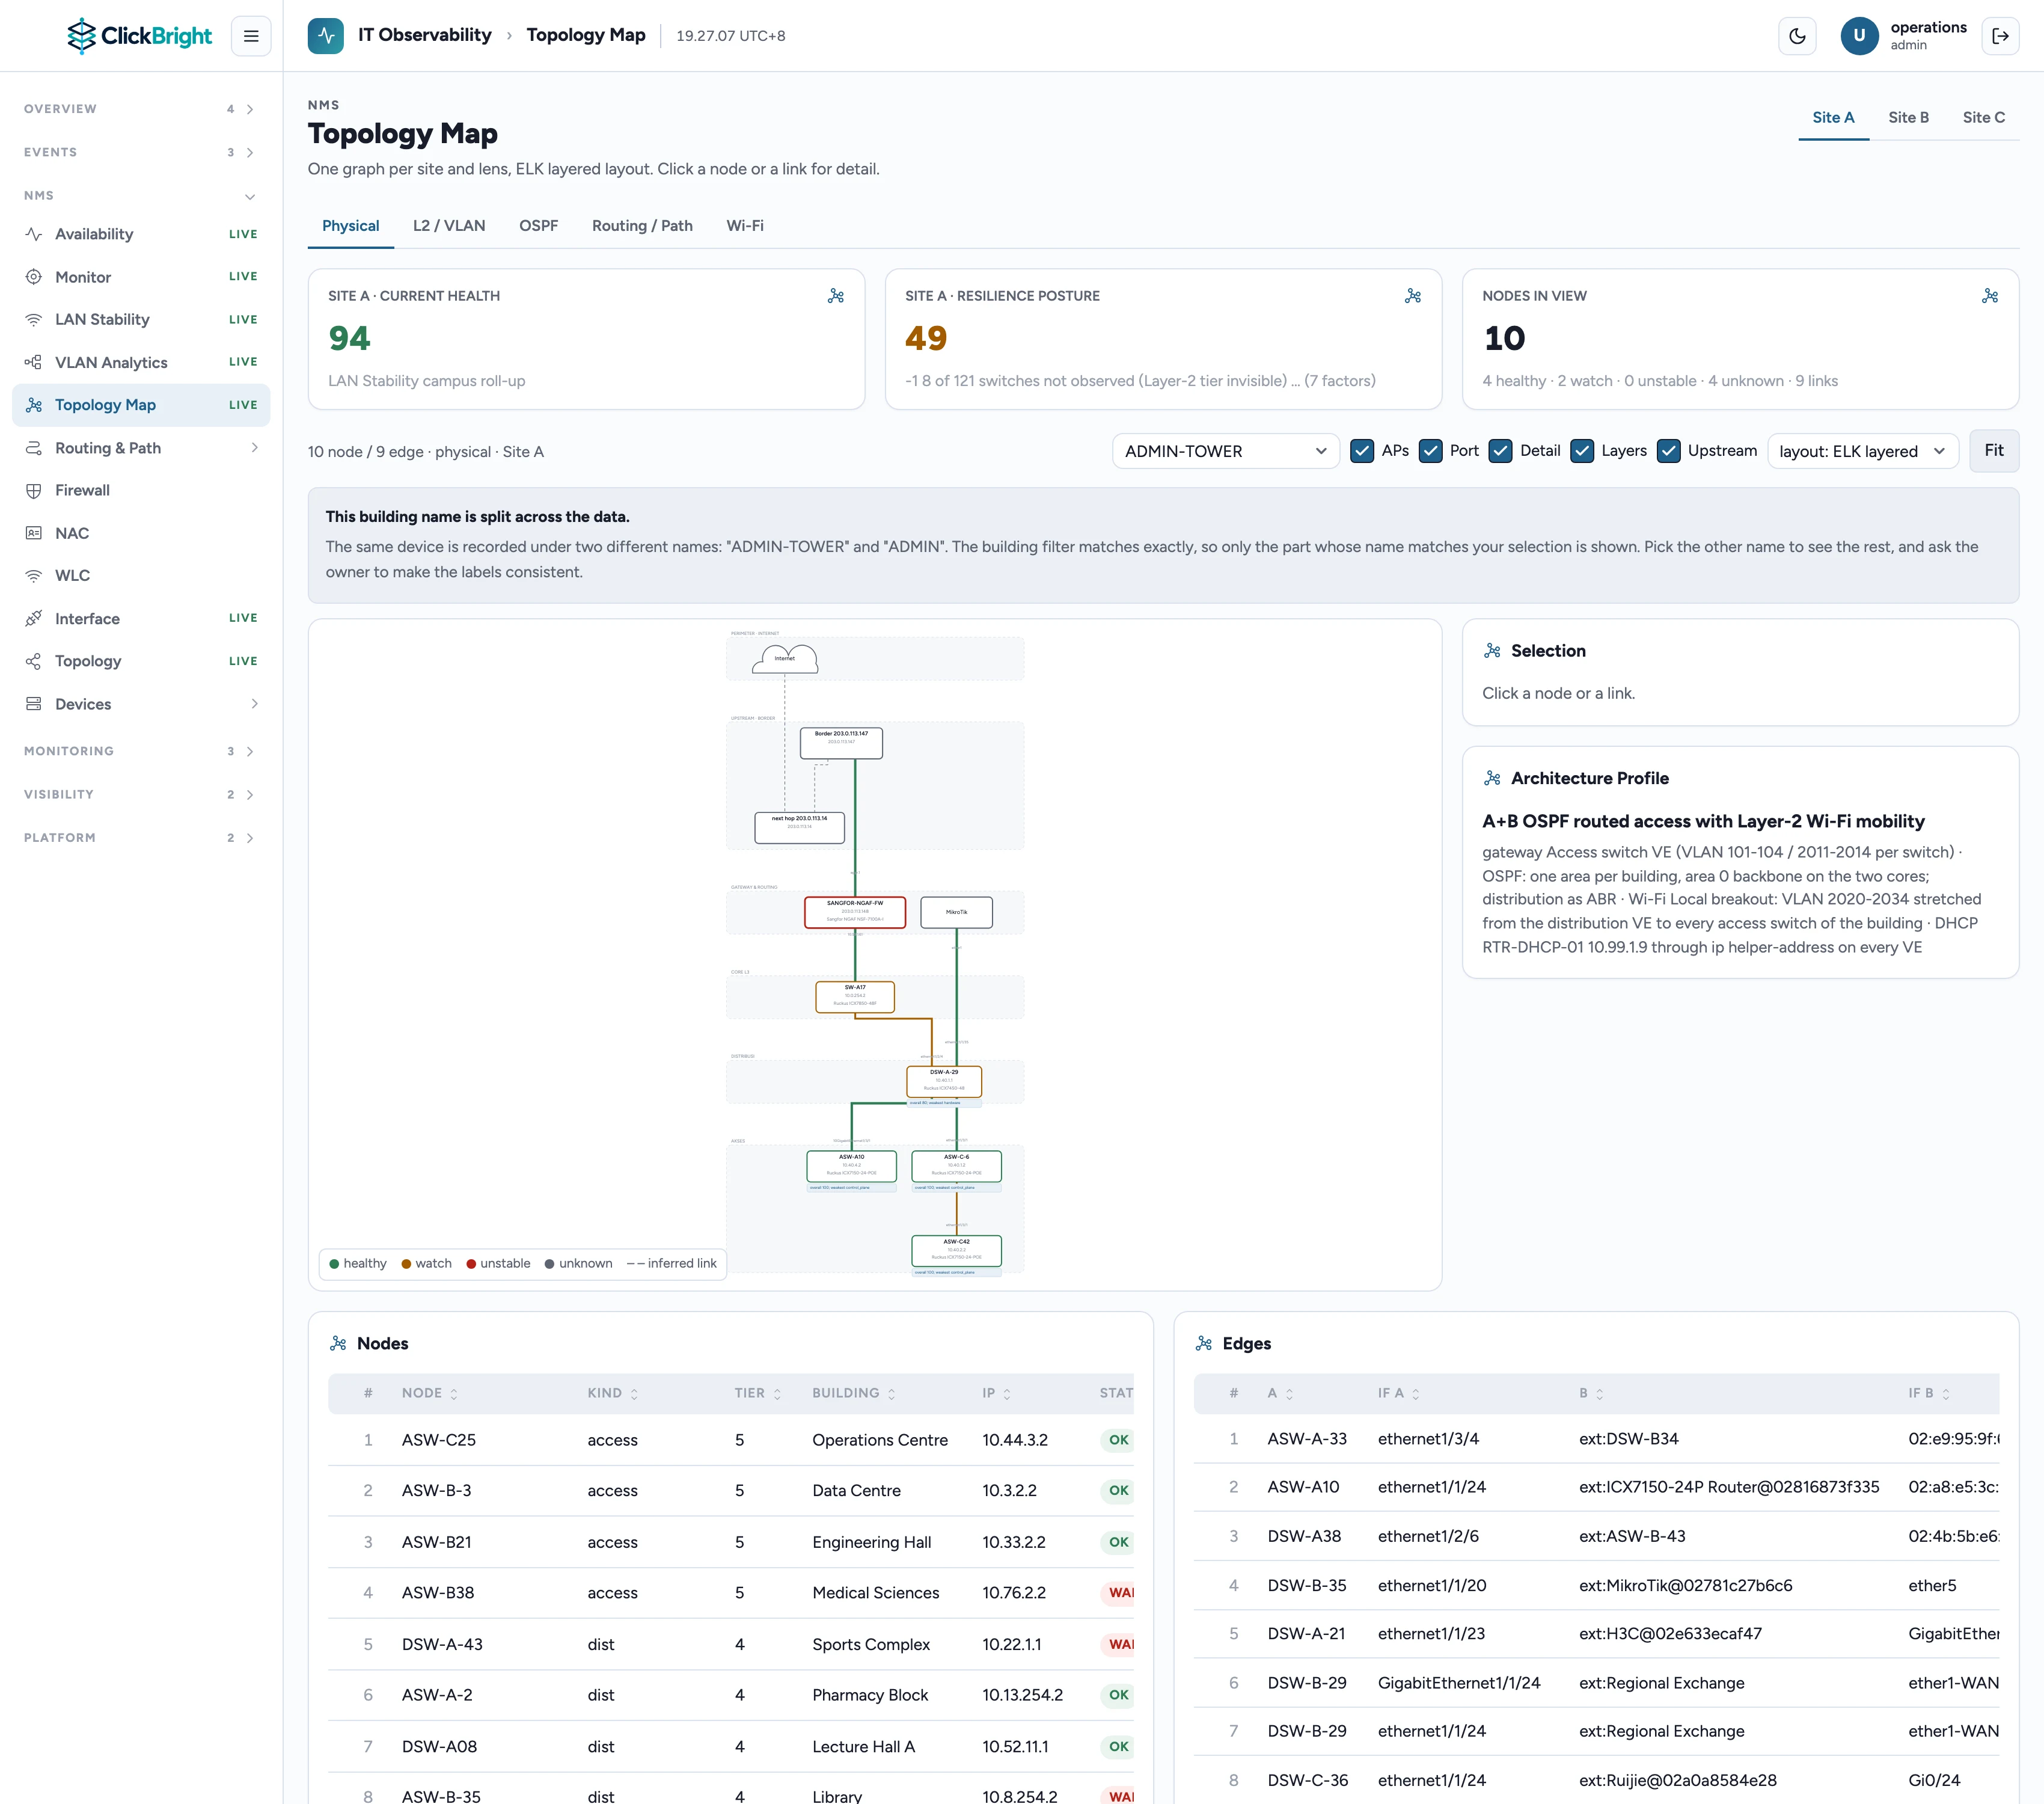
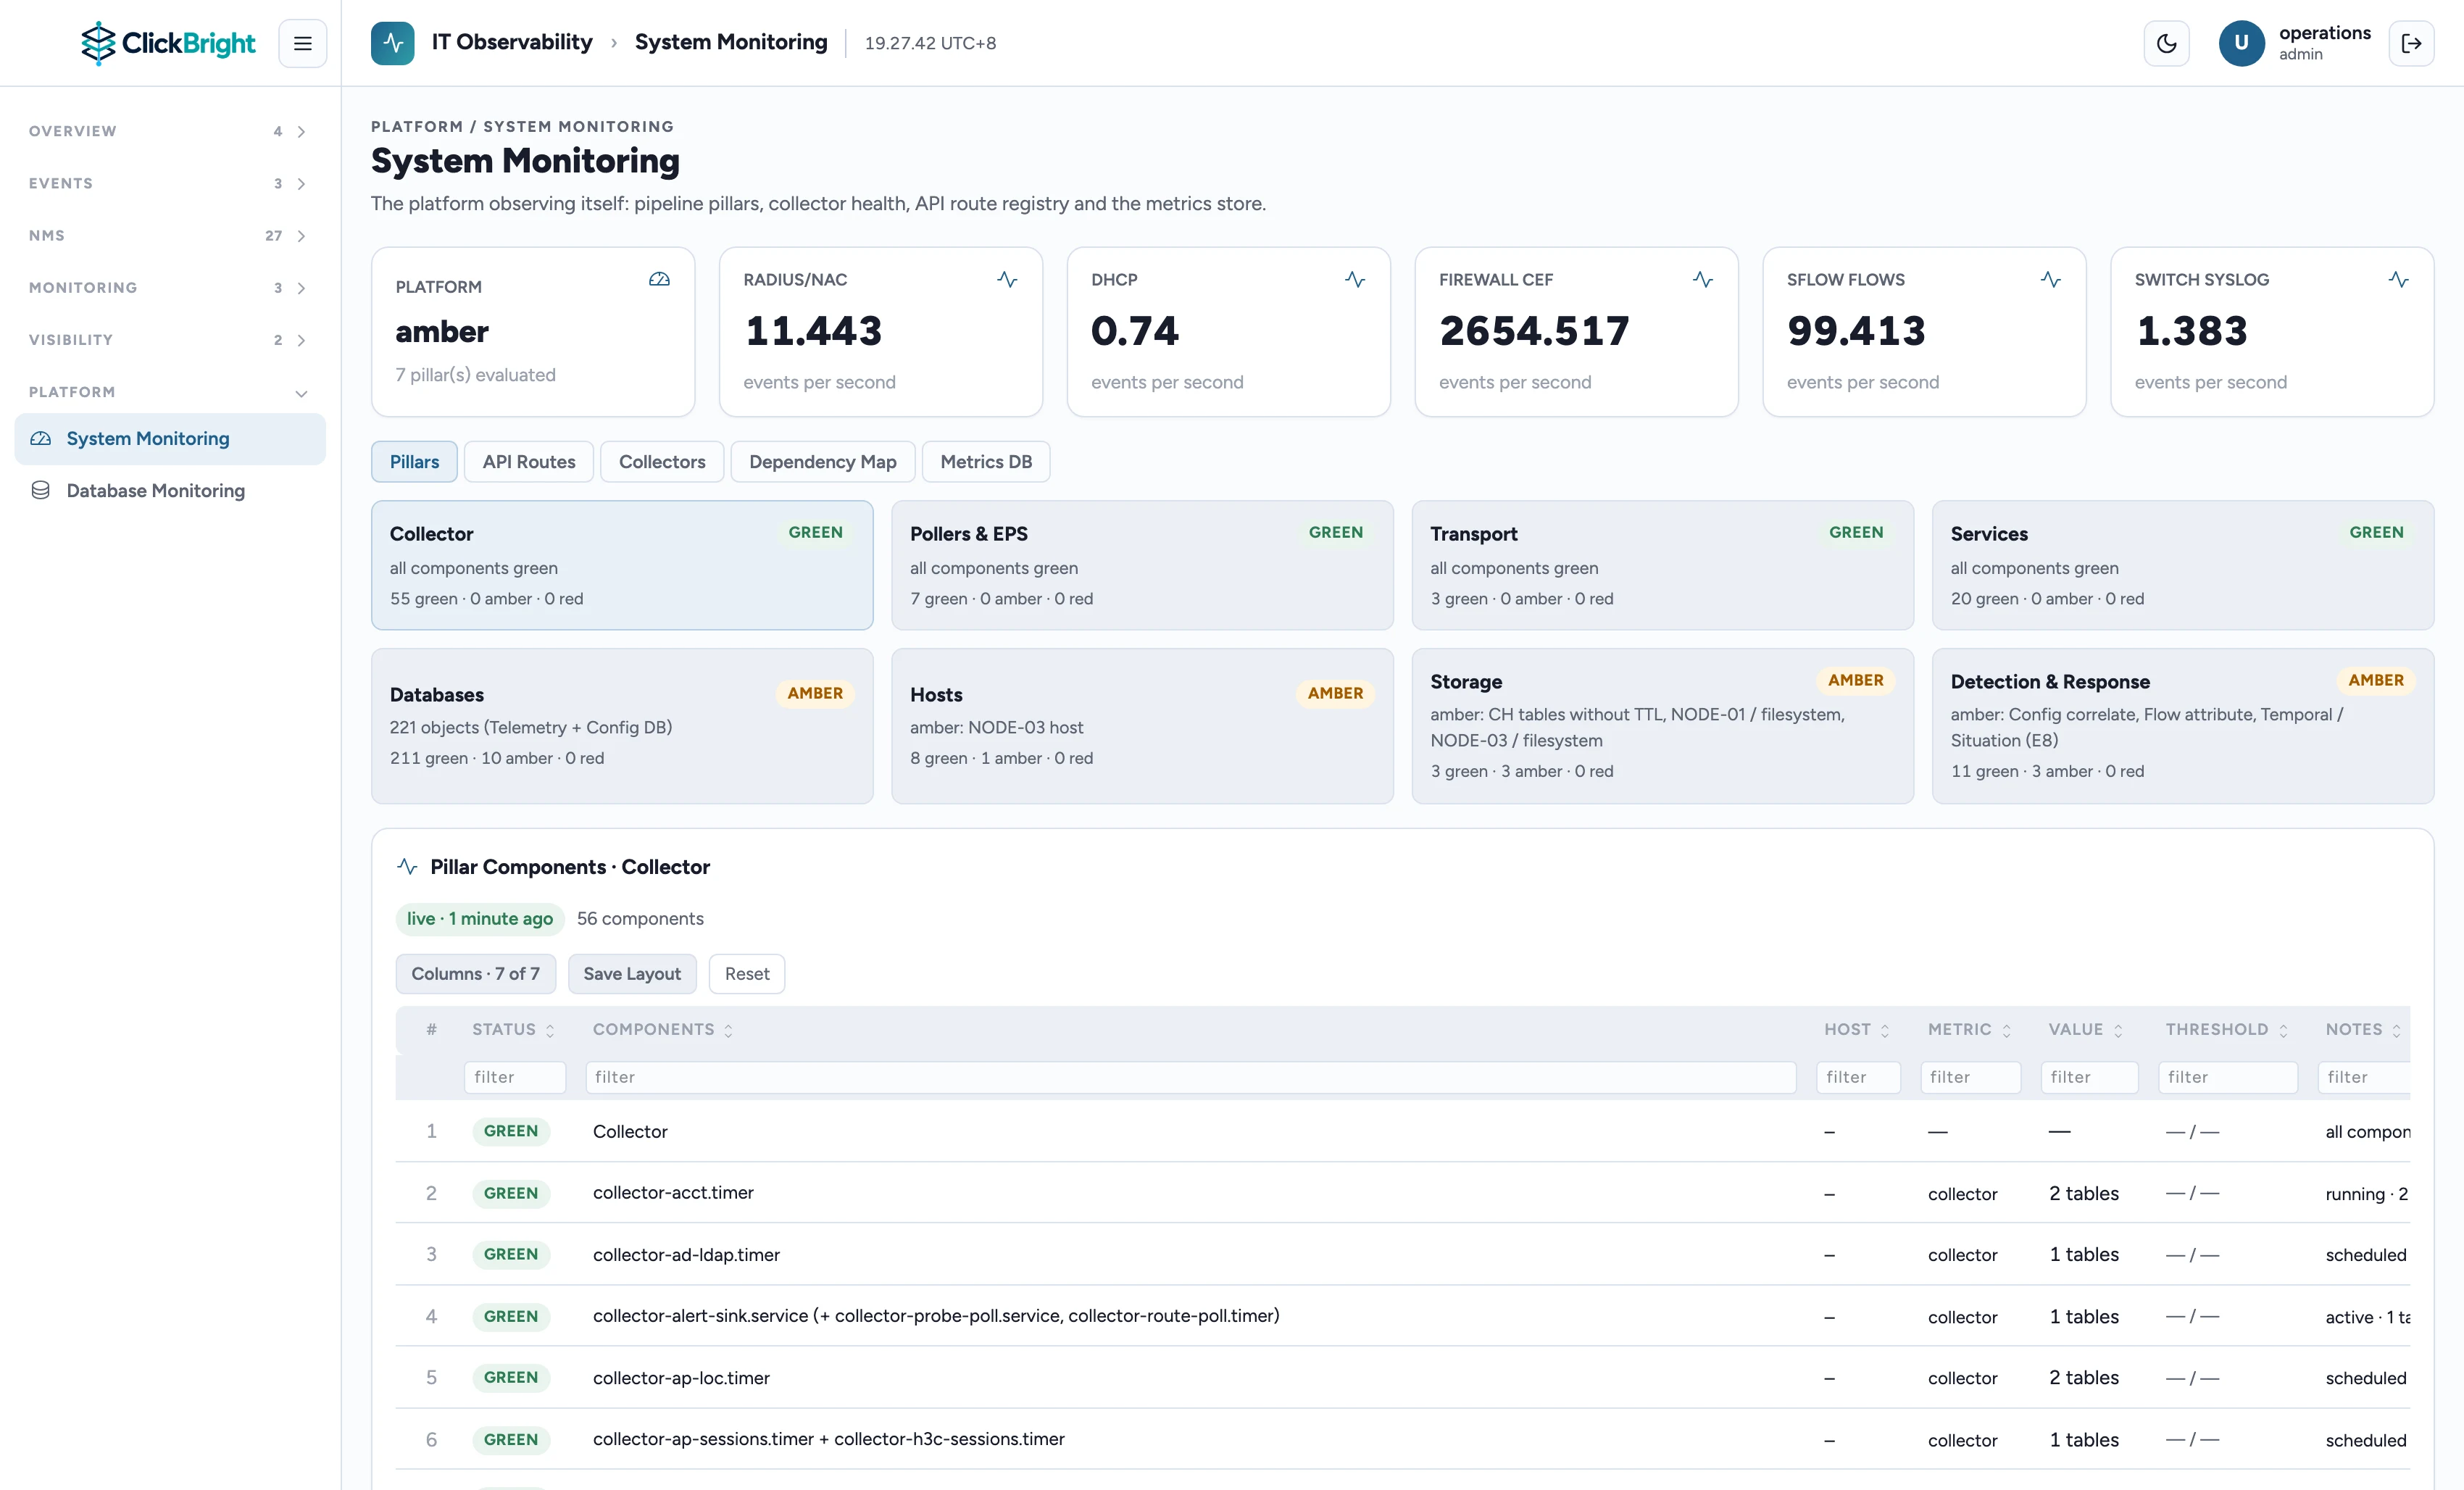
Screens from the running platform on sample data, with every identifier masked.
How This Differs From the Usual Approach
Not a feature count. A question of how many systems you have to buy, integrate and keep alive yourself.
Monitoring, security and response bought separately from different vendors.
Billed on the volume of logs you ingest. The more completely you monitor, the more it costs.
Logs shipped to a provider cloud, often to a data center in another jurisdiction.
Raw numbers on screen. Every reader works out the meaning alone.
Each hardware vendor ships its own console.
Alerts pile up until the team stops opening them.
Answering a question means writing a query, or waiting for the one engineer who can.
Remediation Is Governed,
The operations console reads. It cannot push a config, bounce a port or change a policy. Anything that touches the network runs as an approved workflow, with credentials held in a vault and a full audit trail behind it.
What Makes This DifferentWatch It Work
Recordings of the running platform, using sample data with every identifier masked.
Latest From the Platform
All PostsWhy Our Console Cannot Write
Read-only is not a feature we ran out of time to remove. It is the reason the tool clears a change board in one meeting instead of three.
8 September 2026Who Authenticated Versus What the Network Carried
Access control knows who it let in. Flow data knows what actually moved. The interesting part is the difference between the two lists.
4 September 2026An Empty Table Is Not an Answer
Nothing found and nothing collected look identical on screen. We think a monitoring tool owes you the difference.
Thirty Minutes,
We walk you through the platform on sample data. No install, no obligation.
Request a Demo